Note: this is unfortunately not optimized for phones (yet). Though turning it sideways helps!
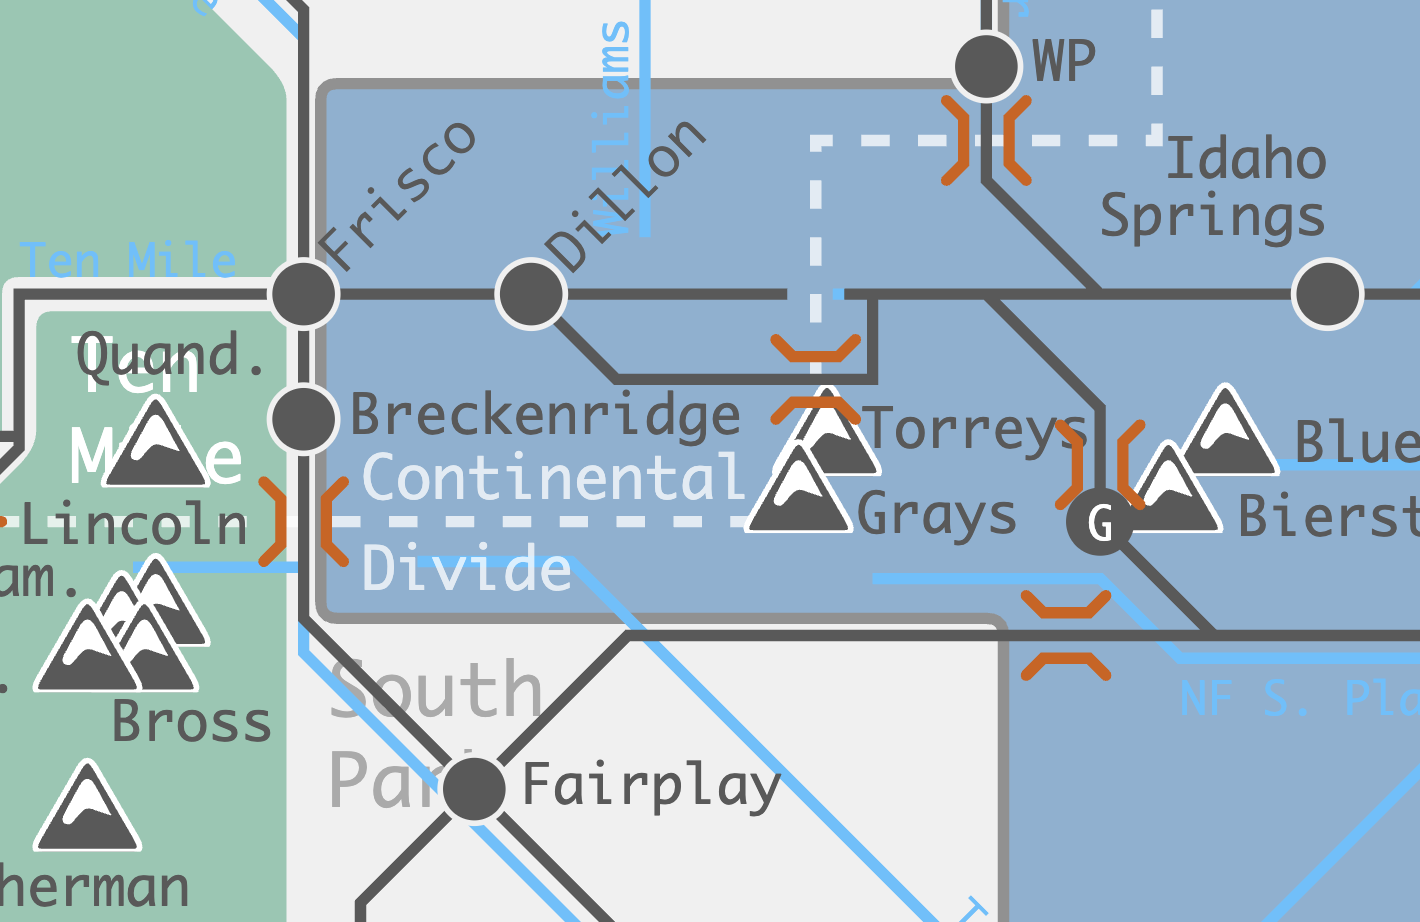
A schematic of the Colorado Rockies
What’s your mental map of the Colorado Rockies? For most of us—residents and visitors alike—it’s something far simpler and more subjective than what we’d load up Google Maps or CalTopo. It usually won’t safely deliver us to some new trailhead or town. For that we need a real map. But it tells a fascinating story about the high-level landmarks we hold space for while navigating through the Centennial State.
This diagram was my attempt to level-up and clarify my mental map of the Colorado Rockies. The goal was not to create something to navigate with. Why bother with so many amazing tools at our disposal? Instead, it offers a more coherent, simplified view of Colorado’s major ranges and rivers. More Harry Beck than George Wheeler.
“Mountain ranges” anchor the map. They are Western Colorado’s core structure and scaffolding. Rivers and roads follow their cues. Valleys and towns exist in their voids. Most ranges and valleys began as rectangles. But as I added new elements to the map, I was forced to introduce more detail.
The exercise is subjective, but I tried to go about it in a consistent way where I could definitely make mistakes. The relative position of landmarks is not subjective. If you find instances where they are placed incorrectly, in relation to one another, please let me know.
What is a mountain range, anyways?
Any reasonable human would agree that the Appalachians and the Rockies are very different and distinct mountain ranges. But what about, say, the Elk Mountains vs the Sawatch Range? In Aspen, Colorado, both ranges are within walking distance of your doorstep. What about the Ten Mile Range vs the Mosquitos?
From everything I’ve seen and read, mountain ranges are named, grouped, and related to one another for a variety of reasons. Sometimes its motivated by science: geology and common origins. You’ll hear phrases like orogeny and anticline thrown around. Often it’s more about how (white) folks in the mid-1800s typically referred to some big group of hills outside of town. Sometimes rivers and passes inform boundaries. Sometimes they don’t.
Fortunately for me, other people have thought very carefully about all this. An accessible and exhaustive resource I relied heavily on is the Peakbagger.com Mountain Range Classification System. It very helpfully slices up every inch of land on the planet into a six-tiered classification of mountain ranges. I treated this as a source of truth not because it’s some infallible and objective resource (the authors readily admit it’s not), but because it’s complete. Using PEMRACS, every mountain in the state—and every river and road—can be successfully mapped to a range or the boundary between ranges.
Curated, not complete
This schematic came with a lot of editorial decisions. The goal was to focus on the Rockies and outdoor recreation. This is why Creede (population 257) appears on the map while Aurora (population ~400,000) does not. Sometimes I had simple rules or lists to rely on: the high points of every mountain range, the named fourteeners. But some labels were far more subjective: “notable” non-14er mountains (I asked Reddit), “developed” hot springs. I tried my best to introduce sensible rules for inclusion. For instance, I include any public ski area with an aerial chairlift, which includes tiny Kendall, but excludes Irwin and Cranor Hill.
Your feedback requested
If you think something important or notable is missing, please send me your ideas! There is potentially even room for entire new layers.
There are over 300 hand-written descriptions on the map, and inevitably some of them will contain mistakes or oversimplifications (For what it’s worth, I found plenty of mistakes, outdated information, and oversimplifications on Wikipedia). Please let me know if you find any issues, or if something fun and interesting seems to be missing.
This graphic uses custom JavaScript, HTML, and CSS. It should work smoothly in most modern browsers, but I haven’t tested every device—iPhones and touch screens might feel a bit clunky right now. Let me know if anything seems off or broken!
Where did that information come from?
All elevations and prominences related to mountain peaks come from listsofjohn.com, which makes use of some relatively recent LiDAR-based surveying data. You will definitely see other numbers around the internet (and on physical signage!) that disagree with these numbers.
As discussed above, the boundaries of mountain ranges come from peakbagger.com. Some of them could be controversial (the Front Range reaches Salida?!). Population numbers and town/pass elevations come from Wikipedia, and are typically the latest estimates I could find.
A broad host of other sources and tools informed the rest of the map elements and their descriptions. 14ers.com, CalTopo, GoogleMaps, Wikipedia, local newsapers (The Colorado Sun, Summit Daily, Vail Daily, Aspen Times, …). The list goes on.
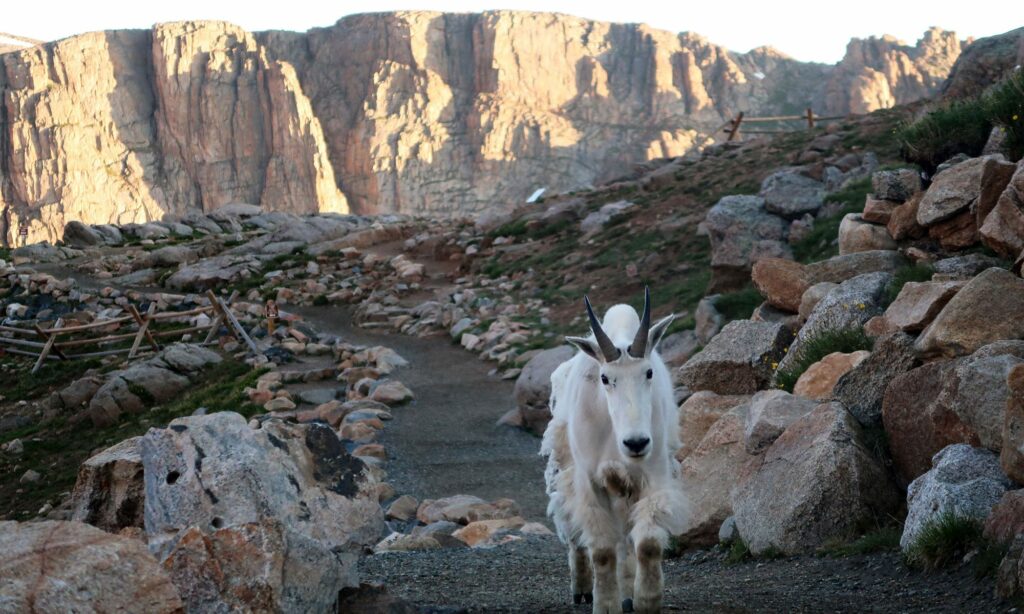
The majority of the photography integrated into this graphic is my own original work. Please ask me before making use of these pictures. One major exception: I include creative commons-licensed images for “notable peaks” where I did not have any good photos. The photographers are credited in these instances.
Interested in more?
I’m looking forward to creating more visual and data-driven content related to both the Colorado Rockies and outdoor recreation more broadly. If you’d like to see more, consider subscribing below for very occasional emails when new interactive graphics or high-value content appears. I also have a handful of past projects that are similarly interactive, with more on the way!
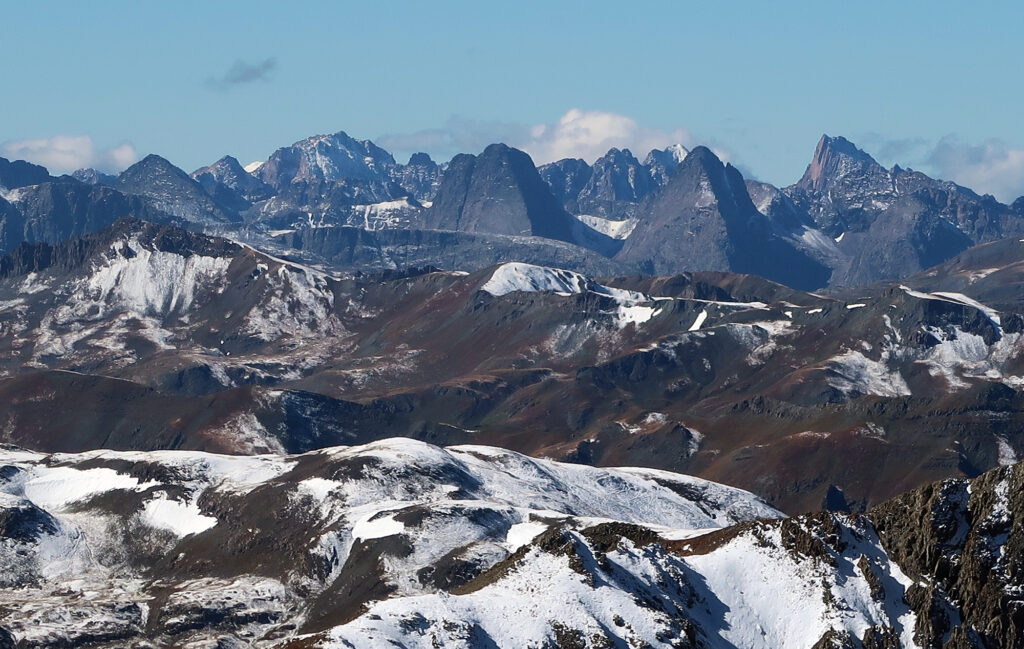
That photo is from the rolling ridge right above verde lake looking at arrow and vestal in the grenadiers. Effectively the camera is to the west of whitehead and south of sugarloaf. The photographer is so far away from Handies and skewed to the west so far its impossible to be from Handies.
I love the subway map of colorado rockies!
I’m fairly certain I took that photo from Handies. You can see more photos from that stunning day here:
https://dismalwilderness.com/handies-peak-via-american-basin/
I love this! It would be cool if you included statewide transit on the roads, city, and passes layer. Amtrak, WPE Ski Train, Bustang, Snowstang, and Pegasus (in addition to local transit services) provide service across the state and are the lifeline of many communities accessing our wilderness areas.